Here’s a thought that occurred to me while staring at my portfolio: Korea’s stock market opens roughly 13 hours before New York. If Samsung Electronics and SK Hynix surge on a Monday morning in Seoul, could I buy Micron before Wall Street opens and catch the same wave? That question sent me down a rabbit hole on memory stock correlation — and what I found changed how I think about my own portfolio, though not in the way I expected.
Let me say upfront what this is and isn’t. I don’t have the data to calculate precise correlation coefficients, so rather than inventing numbers, I traced actual events and price moves over the past six months to see when these three moved together and when they split apart.
Why My Korean ETFs and My US Stock Move Together
The thought started with a simple observation. I hold two KOSPI 200 covered-call ETFs and Micron shares. One is a Korean product, the other a US stock. Yet they turn red on the same days and green on the same days. Since Samsung and SK Hynix make up close to 40% of the KOSPI 200, that connection makes sense.
But why should two companies listed in Seoul move in lockstep with one listed in New York? Three structural reasons.
They are the market. These three control roughly 90% of global memory supply — Samsung around 36%, SK Hynix around 29%, Micron around 24%. When three companies are an industry, they respond to identical variables: DRAM pricing, HBM demand, AI data center capex, Chinese capacity expansion.
They sell nearly identical products. DRAM, NAND, and HBM. Even automakers don’t overlap this completely. Good news for one is usually good news for the other two.
They reference each other with a time lag. Micron’s fiscal calendar means it reports earnings first among the three, so its results read as a leading indicator for the whole memory cycle — and that reading shows up in Korean shares the next day. It runs the other way too; SK Hynix earnings move US memory names.
The Six-Month Picture
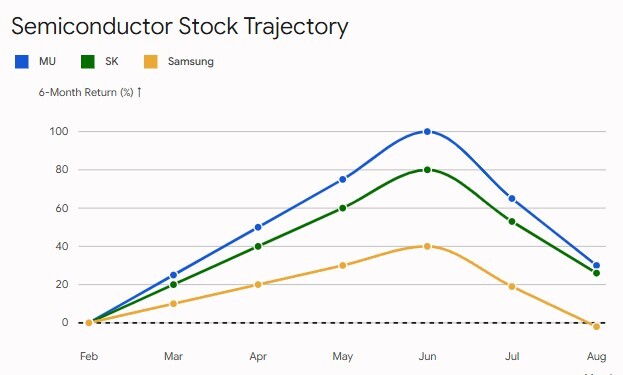
A chart of six-month returns for all three tells the story visually. From February through June, all three climbed together — Micron leading at roughly +100%, SK Hynix at around +80%, Samsung at about +40%. Then from June through August, all three fell together, converging back down toward +30% for Micron and SK Hynix, with Samsung dropping back to roughly flat.
Two things stand out. The shapes are strikingly similar — same peak month, same reversal. But the amplitudes differ enormously. Micron doubled while Samsung gained 40%, and on the way down Samsung gave back proportionally more of its gains. Same direction, very different magnitude.
The Days They Moved as One
May 11 — surging together. Memory decoupled from the broader market on shortage news. The S&P 500 was flat while Micron rose 9% intraday. The same day, SK Hynix jumped over 11% and Samsung over 6%. The index sat still while the memory three moved on their own. A textbook synchronization case.
Late July — crashing together. My most painful stretch. When China’s CXMT listed and exploded 466%, Samsung fell 13.4% and SK Hynix 14%. The KOSPI dropped over 9% with circuit breakers on two consecutive days. Micron, in the same wave, posted its worst month since 2005 — down 15%.
August 4 — rebounding together. Palantir’s strong earnings plus an oversold bounce lifted Micron over 6%, SanDisk 8%, and SK Hynix’s ADR 4%.
Looks conclusive, right? That’s only half the picture.
The Day the Pattern Broke — And Why It Kills the Front-Running Idea
Here’s the counterexample that matters most for my trading idea.
On July 2, Micron fell 5.49% on AI investment fears. The very next day, July 3, Samsung rose 8.22% to ₩309,500 and SK Hynix surged 10.88% to ₩2,425,000.
Micron dropped, and Korea rose double digits the next session. Exactly backwards.
The reason was buried in Micron’s earnings content. Its late-June report showed mobile segment revenue up 254% and automotive/robotics up 311% — a signal that on-device AI, autonomous driving, and humanoid robots are becoming new markets. Autonomous vehicles and robots use several to dozens of times more memory than ordinary devices.
The market read that as better news for Samsung and SK Hynix, the mobile DRAM leaders, than for Micron itself. Micron’s stock was weighed down by its own valuation, while the same earnings content became a catalyst for the two Korean firms.
So the answer to my original question — can I buy Micron on Monday after a strong Seoul session? — is no, not reliably. The direction is usually similar, but you lose money on the days that “usually” breaks. And those days aren’t random: they happen precisely when company-specific factors override the sector story, which is exactly when the move is largest.
There’s an additional practical problem I should be honest about. Even when the correlation holds, by the time Korea closes and US premarket opens, the information is already public and largely priced in. SK Hynix’s ADR trades on the Nasdaq now, which means the arbitrage between Seoul’s close and New York’s open gets closed faster than a retail investor can act on it. The gap I imagined exploiting is mostly already efficient.
What Actually Separates Them
The three diverge along four axes.
HBM competitiveness. SK Hynix leads, Samsung is catching up, Micron sits in its own position.
Business mix. Samsung has foundry, smartphones, and appliances — it isn’t a pure memory play. That’s why its gains were smaller on the way up and its declines proportionally larger when its non-memory divisions dragged.
Valuation. Each has run up by different amounts, so identical news produces different reactions.
Market characteristics. Currency, foreign investor flows, and index weightings differ by country.
This shows up in amplitude, not just direction. SK Hynix routinely moves far more than Samsung on the same news because its HBM concentration makes it more sensitive to the cycle.
The Korean Investor’s Angle
There’s a dimension here that only matters if you’re investing from Korea, and it’s the part I keep coming back to.
When the KOSPI convulses on memory news, it isn’t a sector story — it’s a national one. Samsung and SK Hynix plus preferred shares make up over 60% of the entire KOSPI. So a bad night for Micron doesn’t just hurt my Micron position; it can move Korea’s entire index, my covered-call ETF’s NAV, and by extension my monthly distribution. In July, my distribution actually fell 7.7% because the fund’s asset base shrank during the selloff.
An American investor holding Micron has a sector exposure. A Korean investor holding memory has a sector exposure and a national market exposure and a currency exposure, all wired to the same cycle. There’s also a peculiar wrinkle: when the won weakens during risk-off episodes — which often coincide with memory selloffs — my dollar-denominated positions get a currency cushion while my won-denominated ones don’t. The two exposures aren’t identical even when the underlying story is.
The Real Lesson: Duplication, Not Diversification
The conclusion that actually matters for me isn’t about timing trades.
My assets are far less diversified than I thought. Two KOSPI 200 covered-call ETFs and Micron look like different products in different currencies. They’re really three bets on one memory cycle.
That’s why my entire account turned blue in July. It wasn’t diversification — it was duplication.
I built each position for its own reason: QQQI and the Korean ETFs for monthly income, Micron for AI growth. But reasons don’t determine correlation; underlying exposures do. And underneath, all three answer to the same question: how much memory does AI need next quarter?
What to do about it is my next homework assignment. The honest first step is simply recognizing it, because you can’t manage a concentration you haven’t noticed.
Final Thoughts
Memory stock correlation is real but conditional. Sector-wide news moves all three nearly as one; company-specific news splits them, sometimes violently. That makes front-running Micron off Korea’s session a strategy that works right up until the day it costs you, which is usually the day the move is biggest. The more valuable insight was accidental: my portfolio’s apparent diversification across two countries and three tickers is largely an illusion.
Investment Disclaimer
This article reflects personal opinions based on publicly reported news and market data. It is not financial, investment, tax, or legal advice, and I am not a licensed financial advisor. This is a qualitative observation based on verifiable events and price moves, not a statistical correlation analysis. Relationships between stocks change with time and market regime, and past co-movement patterns offer no guarantee of future behavior. Attempting to time one market based on another carries substantial risk. I hold the assets discussed, which may bias my perspective. Past performance does not guarantee future results, and all investing carries the risk of loss, including the loss of your entire principal. Please do your own research and consult a qualified, licensed professional before making any investment decision.