If you’re starting with a small amount of money, one practical problem hits immediately: dividend ETFs by price vary enormously. Some trade around $10 a share. Others cost more than $200. When you’ve saved up a modest amount and want to start collecting income, the share price becomes a real constraint — not because expensive funds are better, but because you can only buy what you can afford.
So I’ve organized the major dividend ETFs by share price, from the cheapest entry point to the most expensive. But let me say this upfront, because it matters more than anything else in this article: share price tells you nothing about quality. A $10 fund isn’t cheap and a $240 fund isn’t expensive. The price is just what one slice costs. I’m organizing this way purely because it’s the practical constraint when you’re starting small.
Why Share Price Is a Terrible Way to Judge an ETF
Ten shares of a $10 ETF and one share of a $100 ETF cost exactly the same. You own the same amount of money either way. Owning more shares doesn’t mean earning more.
This sounds obvious written down, but it trips up a surprising number of new investors. My five-year-old son would rather have a cup of coins than a single bill worth more. Adults shouldn’t think that way, but the psychological pull of “more shares” is real. Keep it in mind as you read the list below.
The Cheapest Entry: Korean Covered-Call ETFs (₩10,000–20,000 range)
If you’re investing from Korea, the lowest-priced entry points are domestic covered-call ETFs tracking the KOSPI 200. Two things make them worth knowing about: you buy them in won with no currency conversion, and the option-premium portion of their distributions is tax-exempt in Korea, which meaningfully reduces the tax drag.
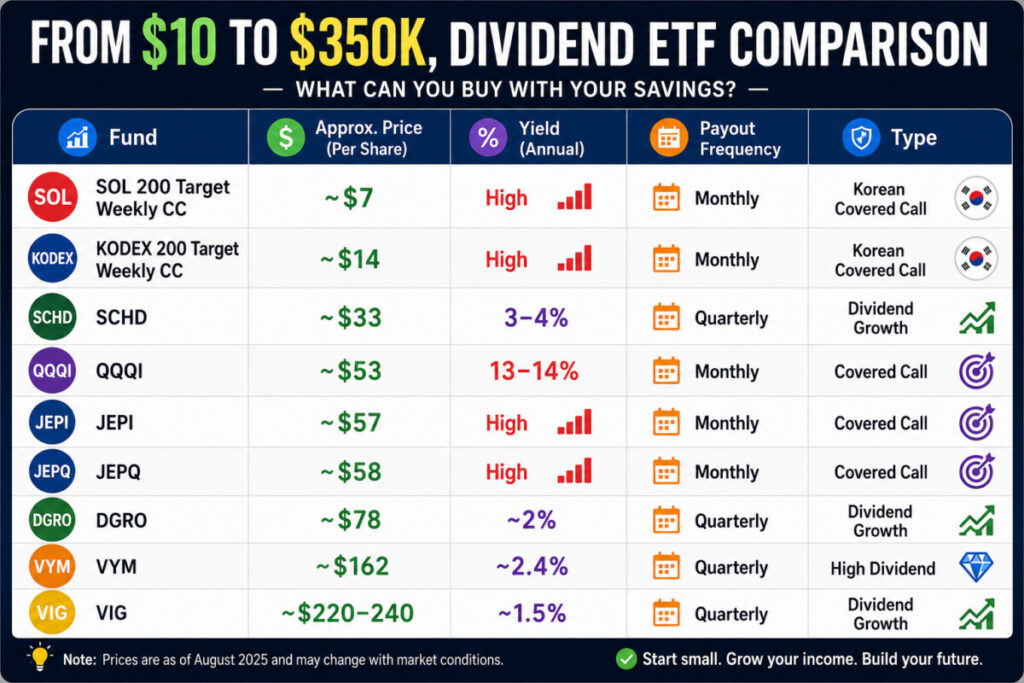
SOL 200 Target Weekly Covered Call trades in the ₩10,000s — roughly $7. It holds the KOSPI 200 and sells weekly call options to generate distributions. Its July distribution was ₩150 per share. I hold 2,800 shares.
KODEX 200 Target Weekly Covered Call trades in the ₩20,000s, roughly $14. Same underlying index, similar structure. Its July distribution was ₩323 per share. I hold 2,000 shares.
These two are essentially sibling products. A useful detail: SOL pays early in the month and KODEX pays mid-month, so holding both spreads your income across the calendar.
Around $33: SCHD — The Dividend Growth Standard
Schwab U.S. Dividend Equity ETF (SCHD) is the fund almost every dividend investor knows. It tracks the Dow Jones U.S. Dividend 100 Index, starting with companies that have paid dividends for at least 10 consecutive years, then screening on four quality factors: cash flow to debt, return on equity, dividend yield, and five-year dividend growth.
The key distinction: it isn’t a covered-call fund. It doesn’t sell options. It simply collects the dividends its holdings pay and passes them through. That means no capped upside — but also a much lower headline yield, in the 3–4% range.
SCHD pays quarterly, not monthly, and its expense ratio is a rock-bottom 0.06%. Its distributions are predominantly qualified dividends, which receive preferential tax treatment for US investors. One honest note: SCHD gained only about 0.73% in 2025, largely because its quality-dividend screen leaves it with essentially no technology exposure — a real drawback during a tech-led rally.
Around $53–58: The Monthly-Income Covered-Call Trio
This is where monthly distributions start, and where the highest yields live.
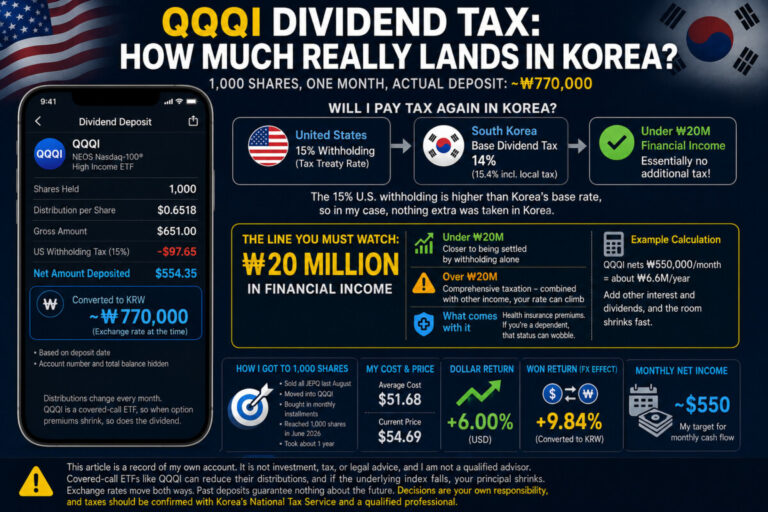
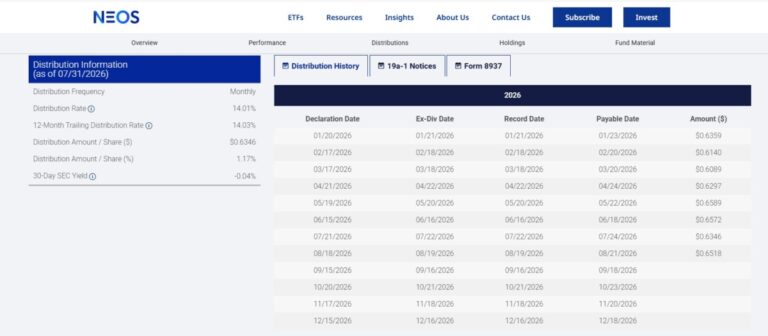
QQQI (NEOS Nasdaq-100 High Income ETF) trades around $53. It holds the Nasdaq-100 and sells call options, paying monthly with a yield in the 13–14% range. I hold 1,000 shares.
There’s an important structural feature here. A substantial portion of QQQI’s distribution is classified as return of capital — meaning part of what you receive is your own principal coming back. That’s tax-advantageous in the short run, but it’s exactly why you can’t judge these funds by yield alone.
JEPI (JPMorgan Equity Premium Income ETF) trades around $57. It’s built on the S&P 500 with a covered-call overlay, paying monthly. Distributions in 2026 have ranged from $0.34 to $0.45 per share.
JEPQ (JPMorgan Nasdaq Equity Premium Income ETF) trades around $58. Same manager, Nasdaq-based instead. Monthly distributions in 2026 have run $0.47 to $0.59 per share.
The differences in one line: JEPI is S&P 500-based and relatively steadier with a lower yield; JEPQ is Nasdaq-based with higher volatility and a higher yield; QQQI is also Nasdaq-based but with a different tax structure and the highest headline yield of the three. Note that JEPI and JEPQ distributions are taxed largely as ordinary income for US investors, unlike SCHD’s qualified dividends.
Around $78: DGRO — Dividend Growth, Broader
iShares Core Dividend Growth ETF (DGRO), run by BlackRock, is SCHD’s closest cousin with a meaningful difference in philosophy.
DGRO requires only 5+ years of consecutive dividend growth rather than SCHD’s 10, so the bar is lower. But it screens out companies with payout ratios above 75% — filtering out firms distributing nearly everything they earn.
The result is over 400 holdings, far broader diversification than SCHD. The yield is lower, around 2%, and the expense ratio is 0.08%.
The simple contrast: SCHD is narrow and concentrated; DGRO is wide and thin. Same dividend-growth philosophy, different execution.
Around $162: VYM — Maximum Breadth
Vanguard High Dividend Yield ETF (VYM) holds 500+ dividend-paying US companies — the broadest fund on this list.
Its yield runs around 2.4% with an expense ratio in the 0.04–0.06% range. The yield isn’t remarkable, but with that many holdings, one company cutting its dividend barely registers.
Around $220–240: VIG — The Biggest of Them All
Vanguard Dividend Appreciation ETF (VIG) is the largest dividend ETF in the US by assets, with roughly ₩180 trillion (about $124 billion) in net assets.
It holds companies with 10+ consecutive years of dividend growth — but with an unusual twist: it excludes the highest-yielding 25% of eligible companies. The logic is that an unusually high yield often signals a company in trouble, so VIG filters those out deliberately.
The consequence is a yield of only about 1.5–1.6%, remarkably low for a “dividend ETF.” What you get instead is blue-chip stability, dividend growth averaging near 7% annually, and a 0.04% expense ratio. VIG returned 13.22% in 2025, helped by roughly 28% technology allocation.
VIG isn’t a fund for receiving a lot now. It’s a fund for holding 10 or 20 years while the dividend compounds upward.
The Three Things That Actually Matter
Forget share price. Here’s what to evaluate instead.
1. Total return, not yield. If you collect a 15% distribution while the share price falls 20%, you lost money. This isn’t theoretical for me — I’m sitting on a roughly ₩8 million unrealized loss in one of my Korean holdings while collecting distributions the whole way down. Yield without price stability is an illusion.
2. Tax structure. For Korean investors, domestic covered-call funds have their option-premium portion tax-exempt, which keeps you further from the ₩20 million financial income threshold that triggers comprehensive taxation and health insurance charges. US ETFs incur 15% withholding, and the full amount counts as taxable income. For US investors, the split between qualified dividends (SCHD, VIG, VYM) and ordinary income (JEPI, JEPQ) matters just as much.
3. Your actual purpose. Need cash every month? Look at QQQI, JEPI, JEPQ. Want to bury money for a decade and let the dividend compound? Look at SCHD, DGRO, VIG. These are different tools for different jobs, and the “best” one depends entirely on which job you’re hiring it for.
One more principle worth internalizing: a high yield usually means something was given up. Covered-call funds trade away part of your upside in exchange for income. There is no free lunch in this asset class.
Quick Reference
Final Thoughts
Organizing dividend ETFs by price is useful when you’re starting small, but it’s the least important thing about any of these funds. Price is just the size of one slice. What determines whether you actually build wealth is total return, tax treatment, and whether the fund’s job matches yours. Start with whatever you can afford — just make sure you know which of those three questions you’re answering.
Investment Disclaimer
This article organizes publicly available information and reflects personal experience. It is not financial, investment, or tax advice, and I am not a licensed financial advisor or tax professional. Prices, yields, and fund assets shown here are approximate and change constantly — verify current figures with official fund documents before investing. Covered-call ETFs carry risks including capped upside, principal erosion, and variable distributions. International ETFs carry currency risk and withholding tax. Tax treatment depends on your individual circumstances and jurisdiction. Past performance does not guarantee future results, and all investing carries the risk of loss, including the loss of your entire principal. Please do your own research and consult a qualified professional before investing.